Menu Engineering for Restaurant Owners: A Profit Guide
Menu Engineering for Restaurant Owners: A Profit Guide

TL;DR:
- Menu engineering involves analyzing menu items based on profitability and popularity to optimize revenue. It categorizes items into four quadrants—Stars, Plowhorses, Puzzles, and Dogs—guiding placement, pricing, and updates for better financial performance. Regular review and deliberate menu design are crucial for maintaining and enhancing restaurant profitability.
Menu engineering is defined as the data-driven process of analyzing every item on your menu by its profitability and popularity, then adjusting pricing, placement, and descriptions to maximize revenue. Developed by professors Michael Kasavana and Donald Smith at Michigan State University, this framework gives restaurant owners a repeatable system for turning menu decisions into measurable financial outcomes. Menu engineering programs typically produce a documented profit lift between 10% and 23%, with most operators achieving 12–18% within 90 days of implementation. That kind of return makes it one of the highest-leverage tools available to any restaurant manager. This guide breaks down exactly how it works and how to apply it.
What is menu engineering and how does it work?
Menu engineering is a rigorous financial and operational analysis, not a cosmetic menu update. The framework classifies every item on your menu into one of four quadrants based on two metrics: contribution margin (how much profit the item generates per sale) and popularity (how often guests order it). This classification system is the Kasavana-Smith matrix, and it produces four categories that drive every decision you make.

The four quadrants of the matrix are Stars, Plowhorses, Puzzles, and Dogs. Stars are high-margin and high-popularity items. They are your best performers and deserve prime placement and strong visual emphasis. Plowhorses are popular but low-margin. Guests love them, but they cost you money at scale, so your job is to either reduce their food cost or reposition them on the menu. Puzzles are high-margin but low-popularity. They are profitable when ordered but rarely chosen, which means they need better placement, stronger descriptions, or a price adjustment to attract attention. Dogs are low-margin and low-popularity. They occupy space on your menu without earning their keep, and most should be removed.
Calculating contribution margin requires knowing two numbers: the selling price of the item and its total food cost. Subtract food cost from selling price and you have the contribution margin. An engineered menu must be grounded in precise recipe costing that accounts for every ingredient and waste factor to keep those margins accurate. Popularity is measured as a percentage of total sales volume, often pulled directly from your point-of-sale (POS) system.
Pro Tip: Run separate menu engineering analyses for lunch and dinner. Item performance and profitability often vary significantly by daypart, and a single combined analysis can mask which items are actually driving profit during each service.
How do menu design principles support your menu strategy?
Once you know which items belong in which quadrant, design becomes your delivery mechanism. The goal of menu design principles is to direct guest attention toward your Stars and Puzzles before they ever consciously make a decision. A guest spends less than 109 seconds scanning a menu, which means the visual hierarchy you create does most of the selling.
The "Golden Triangle" describes the three focal zones where guest eyes naturally land first: the center of the page, the top-right corner, and the top-left corner. Placing high-margin items within these Golden Triangle zones can increase sales of those items by up to 30%. That single placement decision costs nothing to implement and can meaningfully shift your revenue mix.
Language is equally powerful. Descriptive, sensory-rich language for menu items leads to a 27% increase in sales for those items, making it one of the most effective low-cost optimizations available. Terms that imply cooking technique and labor, such as "charred," "braised," or "slow-roasted," justify higher price points and raise perceived value before the guest even looks at the price.
Pricing presentation also shapes behavior in ways most operators overlook:
- Remove currency symbols. Dropping the dollar sign reduces the "pain of paying" and increases willingness to spend.
- Use nested pricing. Place the price at the end of the item description in the same font size rather than right-justified in a separate column. This prevents guests from scanning prices first and ordering by cost instead of desire.
- Avoid price columns. A right-justified price column turns your menu into a spreadsheet and encourages guests to shop by number rather than by appetite.
Pro Tip: Menu material quality signals brand value before a guest reads a single word. A laminated, worn menu communicates low standards. A well-constructed printed or digital menu reinforces the experience you are selling. For guidance on connecting menu design to sales, the relationship between layout and revenue is well documented.
What are the most common menu engineering mistakes?
The most damaging mistake in menu engineering is treating it as a graphic design project. Prioritizing graphic design over rigorous analysis leads to margin erosion when costing is inaccurate. A beautiful menu built on wrong numbers will cost you money every service.
Here are the mistakes that consistently undermine results:
- Skipping contribution margin calculations. Operators who redesign menus without verifying exact food costs are guessing. Guessing at margins is how profitable items get buried and money-losing items get featured.
- Ignoring item count per category. Too many options per category causes decision fatigue. The sweet spot is 7 to 10 items per category. More than that and guests slow down, feel overwhelmed, and often default to familiar choices rather than high-margin ones.
- Treating menu engineering as a one-time event. Food costs shift with supplier pricing, seasonal availability, and inflation. A menu engineered in January may be misaligned by April if you have not recalculated margins.
- Ignoring placement psychology. Putting a Dog item in a Golden Triangle zone because it photographs well is a direct cost to your bottom line. Placement decisions must follow the data.
- Failing to separate daypart data. A burger that is a Star at lunch may be a Plowhorse at dinner if your dinner guests order it less frequently. Combining the data hides the real picture.
Pro Tip: Limit yourself to 7 to 10 items per category when building or revising your menu. This is not just about aesthetics. It is a choice architecture decision that speeds ordering, reduces guest anxiety, and increases the probability that guests select the items you most want them to order.
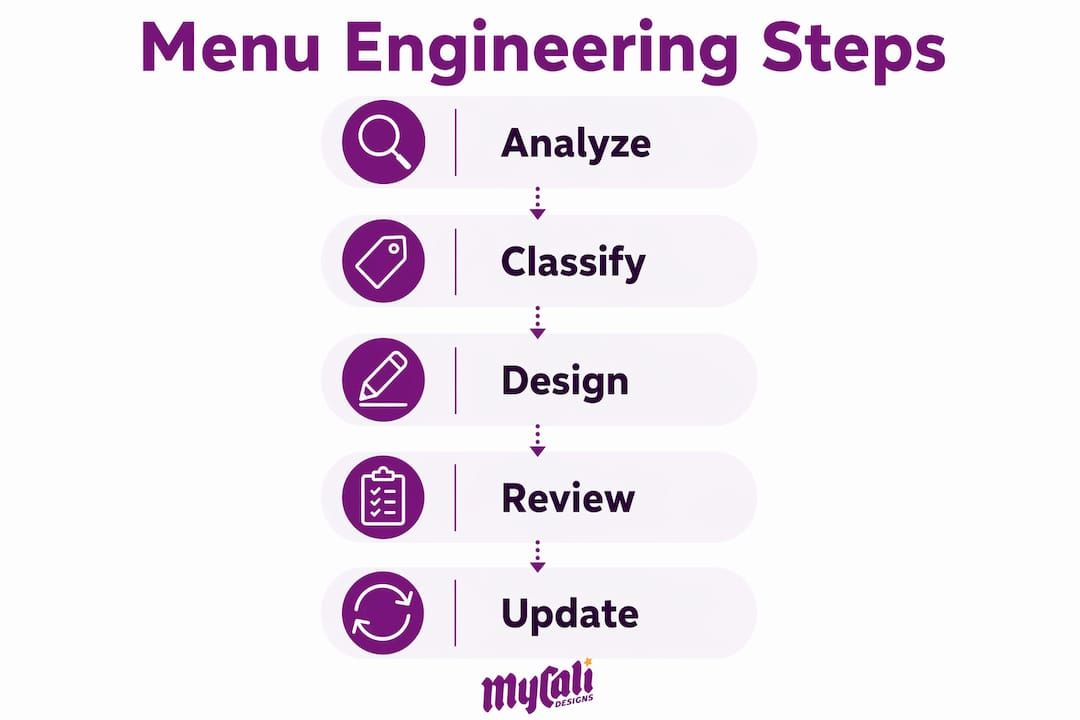
How to implement menu engineering in your restaurant
Over 70% of restaurants consider menu optimization fundamental, yet only 27% rigorously analyze sales and costs before making changes. The gap between intention and execution is where most operators lose money. The following steps close that gap.
-
Gather accurate cost and sales data. Pull 90 days of sales data from your POS system. Build or verify a recipe cost card for every item, accounting for every ingredient, portion size, and waste factor. This is your foundation. Inaccurate cost data produces inaccurate quadrant classifications.
-
Calculate contribution margin and popularity for each item. Subtract food cost from selling price for each item. Divide each item's sales count by total items sold to get its menu mix percentage. These two numbers place every item in the matrix.
-
Build your Kasavana-Smith matrix. Plot each item on a simple 2x2 grid. Stars go in the top-right (high margin, high popularity). Plowhorses go in the bottom-right (low margin, high popularity). Puzzles go in the top-left (high margin, low popularity). Dogs go in the bottom-left. This visual immediately shows you where to focus.
-
Take category-specific action. Feature Stars prominently in Golden Triangle zones with strong descriptions. For Plowhorses, reduce portion size slightly, renegotiate ingredient costs, or bundle them with higher-margin sides. Reposition Puzzles with better placement and richer language. Remove or replace Dogs unless they serve a strategic purpose, such as anchoring a price point.
-
Test and measure. Roll out changes and track sales data for 30 to 60 days. Compare contribution margin totals before and after. Look for shifts in menu mix percentages. The data will tell you whether your changes worked or need further adjustment.
-
Schedule quarterly reviews. Set a calendar reminder every 90 days to revisit your cost cards and sales data. Integrate this review with your supplier negotiations and seasonal menu planning. Menu engineering is not a project with an end date. It is an ongoing operational discipline. Connecting it to your broader restaurant marketing strategy ensures that your most profitable items also get visibility beyond the table.
Key takeaways
Menu engineering works because it combines precise financial analysis with deliberate design decisions to direct guest behavior toward your most profitable items.
| Point | Details |
|---|---|
| Use the Kasavana-Smith matrix | Classify every item as a Star, Plowhorse, Puzzle, or Dog before making any design changes. |
| Calculate exact contribution margins | Accurate recipe costing is the foundation. Wrong numbers produce wrong decisions. |
| Apply Golden Triangle placement | Position high-margin items in the center, top-right, and top-left zones to capture guest attention first. |
| Limit items per category | Keep 7 to 10 items per category to reduce decision fatigue and speed ordering. |
| Review every 90 days | Food costs shift constantly. Regular updates keep your matrix and margins accurate. |
Why menu engineering changed how I think about restaurant design
I have worked with enough restaurant owners to know that most of them think about their menu the way they think about their logo: something you create once, maybe refresh every few years, and otherwise leave alone. That mindset is expensive.
What I have seen repeatedly is that the restaurants struggling most with profitability are not struggling because of bad food or poor service. They are struggling because their menu is doing financial work they have never measured. A Plowhorse item that sells 200 times a week at a 12% contribution margin is quietly costing the business thousands of dollars in opportunity cost every month. No one notices because the item is popular and the kitchen knows how to make it.
The discipline of menu engineering forces you to confront those numbers directly. And that is uncomfortable at first. Operators get attached to items. Chefs have pride in dishes. But the matrix does not care about sentiment. It tells you what is working financially and what is not.
What I find most encouraging is that the fix is rarely dramatic. Moving a Puzzle item from the bottom of a category to a Golden Triangle zone, rewriting its description with sensory language, and removing the currency symbol from its price can shift its order frequency without changing the dish at all. That is the power of combining data with design.
The restaurants that treat menu engineering as an ongoing practice rather than a one-time project are the ones that build durable margins. They review quarterly, they update cost cards when supplier prices change, and they train their staff to understand which items the business most needs to sell. That last part matters more than most operators realize. A server who knows your Stars and can describe them confidently is part of your menu engineering system.
— Cesar
How Mycalidesigns can support your menu and brand
Your menu engineering analysis tells you what to feature and where. But the physical and digital execution of that menu is where brand identity either reinforces or undermines the work you have done.
At Mycalidesigns, we work with restaurant owners to make sure the design of your menu reflects the quality of your food and the strength of your brand. From custom logo and branding systems that carry through every guest touchpoint, to printed and digital menu layouts built around your engineering priorities, we help you present your best items in the way they deserve. If you are ready to make your menu work harder for your business, we would love to be part of that process.
FAQ
What is the Kasavana-Smith model in menu engineering?
The Kasavana-Smith model is a four-quadrant matrix that classifies menu items as Stars, Plowhorses, Puzzles, or Dogs based on contribution margin and popularity. It was developed at Michigan State University and remains the standard framework for menu engineering analysis.
How much can menu engineering increase restaurant profit?
Menu engineering programs typically produce a profit lift between 10% and 23%, with most operators reaching 12% to 18% within 90 days of implementation. Results depend on the accuracy of cost data and the consistency of ongoing reviews.
How often should you update your menu engineering analysis?
A quarterly review is the standard recommendation, since food costs and guest preferences shift regularly. Operators should also re-analyze whenever a major supplier price changes or a new seasonal menu launches.
What is the difference between menu engineering and menu design?
Menu engineering is the financial and analytical process of classifying items by profitability and popularity. Menu design is the visual and psychological execution that directs guest attention. The two work together: engineering tells you what to feature, and design determines how effectively guests find it.
How many items should a restaurant menu have per category?
The recommended range is 7 to 10 items per category. More than 10 options triggers decision fatigue, slows ordering, and reduces the likelihood that guests choose your highest-margin items.
Recommended
Recent Posts